Yes, this is a textbook topic. Somewhere in a media planning class a professor drew this on a whiteboard, you copied it down, and you never used it again. Here’s the version you’ll actually use, because the answer tells you whether your budget is reaching new homes or the same few over and over.
The short version is that reach is how many households saw your ad, frequency is how many times the average one of them saw it, and frequency equals impressions divided by reach.
It’s also the fastest way to check whether the numbers on your streaming report mean what they seem to.
The reach and frequency formula
Frequency = impressions ÷ reach
Reach = impressions ÷ frequency
Google’s marketing mix modeling documentation defines frequency the same way, as total impressions divided by reach, and it counts reach as the unique individuals exposed within each time period, not a running total.
A worked example of reach and frequency
Say your campaign delivers 1,200,000 impressions in a month and reaches 300,000 households. Frequency is 1,200,000 ÷ 300,000, which is 4. Each household saw your ad four times that month on average, which is a little under once a week.
If your goal was twice a week, you’d want about nine views a month per household. This campaign is running at less than half of that, so it’s either under-delivering or spread too thin.
Now use the formula to check a reach and frequency report
The formula runs both ways, which turns it into a lie detector. Take any two numbers from a report, work out the third and compare it with what the report says. If a report shows 1,200,000 impressions and 300,000 households but claims a frequency of 2, the math doesn’t hold, and someone owes you an explanation.
Some reports give you only two numbers, total impressions and an average frequency. That’s enough to work out reach, because reach equals impressions divided by frequency. A report with 1,200,000 impressions and an average frequency of 4 reached 300,000 households. Two checks follow from that.
- Compare that reach with the number of households you targeted. Reach can’t be larger than the audience, so if it is, the report is probably counting devices, not homes.
- If you set a weekly cap, multiply it by the number of weeks in the flight. The average frequency can’t be higher than that number.
What the two numbers can’t tell you is the spread, and the spread is where the waste lives. Take those same 1,200,000 impressions and 300,000 households. If 30,000 households (10% of them) saw your ad 20 times each, that’s 600,000 impressions, half of everything you bought. The other 270,000 households would have averaged a little over 2 views, and the report would still say 4.
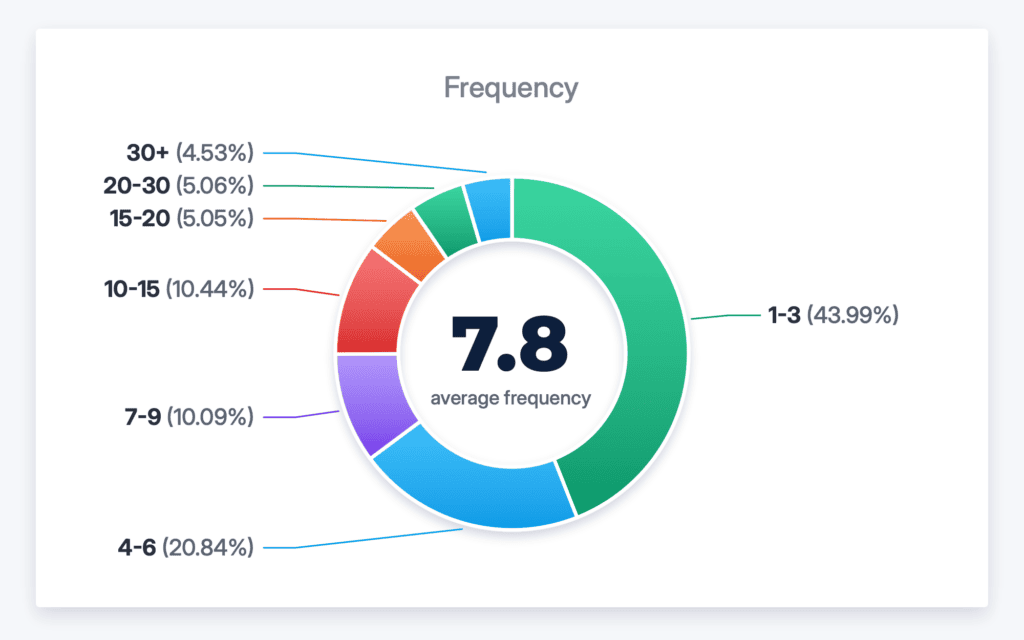
Even when the numbers agree, the frequency can flatter the campaign without anyone lying. Here are five ways it happens.
- It’s an average. As the example above shows, a few households can absorb half your impressions while the average still looks fine. Ask for the distribution by household. In GammaBurst you see how many households fall into each frequency band, so the tail where budget is wasted is easy to spot.
- It counts devices, not households. One home with three TVs can read as three people, which makes reach look bigger and each person’s frequency look lower than the household’s real number.
- It’s counted and capped inside each publisher. A household that sees your ad on four publishers can show a frequency of 2 on every one of them when its real total is 8, because each publisher applies its own cap and none of them sees the household’s full total.
- It covers the whole flight. Four views over three months is a very different campaign from four views in one week.
- The cap is missing or too loose. A campaign can run with no cap at all, or with a cap on the total for the whole flight instead of a daily or weekly limit, which lets a household see most of its views in a few days.
None of these needs bad intent, because each one is just the easy way to count. Each one still leaves you with a number that looks calmer than what a household actually experienced. Ask your vendor about each one before you renew.
What frequency should you aim for on streaming TV?
There’s no single right number, so we dig into the data to find it for each campaign. In the education accounts we run, households typically saw an ad about three to seven times a month, which is roughly once a week, though that’s what we’ve seen, not a target. Here’s what we look at:
First, we look at each audience separately, because one cap can hide two buyers. In our retail case study, a national retailer was running one weekly cap across two audiences. When we split them, parents did best at about one connected TV impression a week, while business buyers needed six to eight. Capping each audience separately lifted streaming RoAS 48% within 30 days.
Second, we look at results by frequency band, because both extremes cost you. Too few views and nobody remembers you. Too many and you pay to reach people who already got the message. When we pulled one personal injury firm’s results by frequency band, the households that saw the ad 15 to 30 times produced the most calls and forms, and the ones that saw it 100 or more times added no conversion value.
Third, we check whether the same impressions could reach new homes, because cutting frequency can also grow your audience. For a multi-campus trade school, lowering frequency raised the number of unique households reached by more than half, because the same impressions went to new homes.
Google’s modeling documentation explains why this happens, with a minimum frequency that helps people remember you and a point past which fatigue and diminishing returns set in.
How to set frequency
- Pick a weekly target for each audience, based on your own data.
- Cap frequency before you bid. Our bidder, GammaRay, checks the cap on every bid request and skips the bid when a household has hit it, so you don’t pay for the extra impression.
- Read the distribution every week and move impressions from the tail to households you haven’t reached.
- Judge the result by calls, applications or sales, not by reach alone.
Common questions about reach and frequency
What is reach and frequency in advertising?
Reach is the number of households that saw your ad at least once. Frequency is how many times the average one of them saw it. Together they tell you how many people you’re talking to and how often.
What’s the difference between reach and frequency?
Reach counts the households that saw your ad. Frequency counts how many times the average one of them saw it. At the same budget, raising one lowers the other.
How do you calculate frequency?
Divide total impressions by reach. If 1,200,000 impressions reached 300,000 households, the frequency is 4.
Is reach the same as impressions?
No, impressions count every time your ad plays, while reach counts each household once, so impressions equal reach times frequency.
What’s a good frequency for streaming TV?
There’s no single right number, so we find it for each audience by looking at results by frequency band, and you can ask your vendor for that view.
Should you focus on reach or frequency?
It depends on where your audience is, as this table shows.
| Your situation | Lean toward | Why |
|---|---|---|
| You’re introducing your brand to people who don’t know you | Reach | More households need to see you at least once |
| You’re following up with people who already visited your site | Frequency | They know you, so a few more views keep you in mind |
| Frequency is already well above your target | Reach | Extra views on the same homes are wasted, so spread them to new ones |
How do you cap frequency?
Set a limit on views per household over a period, and apply it before the bid. We do this in our bidder, GammaRay, so you don’t pay for the extra impression.
What does GRP mean in advertising?
GRP stands for gross rating points. It’s used mainly in traditional TV and radio buying, though streaming campaigns sometimes use it to compare against linear. You get it by multiplying the percent of your target audience you reached by the average frequency, so reaching 40% of the audience an average of 3 times is 120 GRPs.
Check your own campaign
Not sure your frequency numbers hold up? Send us your campaign data and we’ll show you where the gaps are on a call. Audit my streaming spend