
CTV Advertising
Reach the biggest screen in the house.
Analytics that direct in-flight decisions.
Your campaign runs on every major streaming platform.


Streaming finally made television targetable down to the household.
Here is what makes streaming and CTV worth a serious line in the media plan, for both brands and the agencies that serve them.
CTV advertising delivers ads to streaming apps on internet-connected televisions, with household-level targeting and publisher and app-level reporting that linear TV cannot provide.
The screen people actually watch.
Streaming reaches households on the biggest screen in the home, where people watch with intent instead of scroll past in a feed.
Precision linear television cannot deliver.
You can target households by income, location, life stage, behavior, and your own customer data, with the kind of granularity digital buyers already expect.
Reporting at the publisher and app level.
See where every impression ran, on which app, in front of which audience, with attribution back to the dollars you spent.
Most CTV isn't really CTV.
Some CTV inventory ends up running on phones, tablets, and desktops, not on actual televisions. We built our platform so every impression you buy from us runs on a real TV, and so you can see exactly which one.
What some vendors sell as CTV
What we deliver, every time
100%
Living room screens, every impression.
TV MEANS TV
CTV reporting that answers the question your CFO will ask.
Most CTV reports show delivery numbers like impressions served and completion rates, which tell you the campaign ran but not whether it worked. Ours shows which publishers, apps, and audiences actually drove conversions, with CTV attribution that does not collapse everything to the final click.
What every CTV advertising report shows you
View geographic performance down to the DMA level, with state and metro-area breakdowns on every campaign.
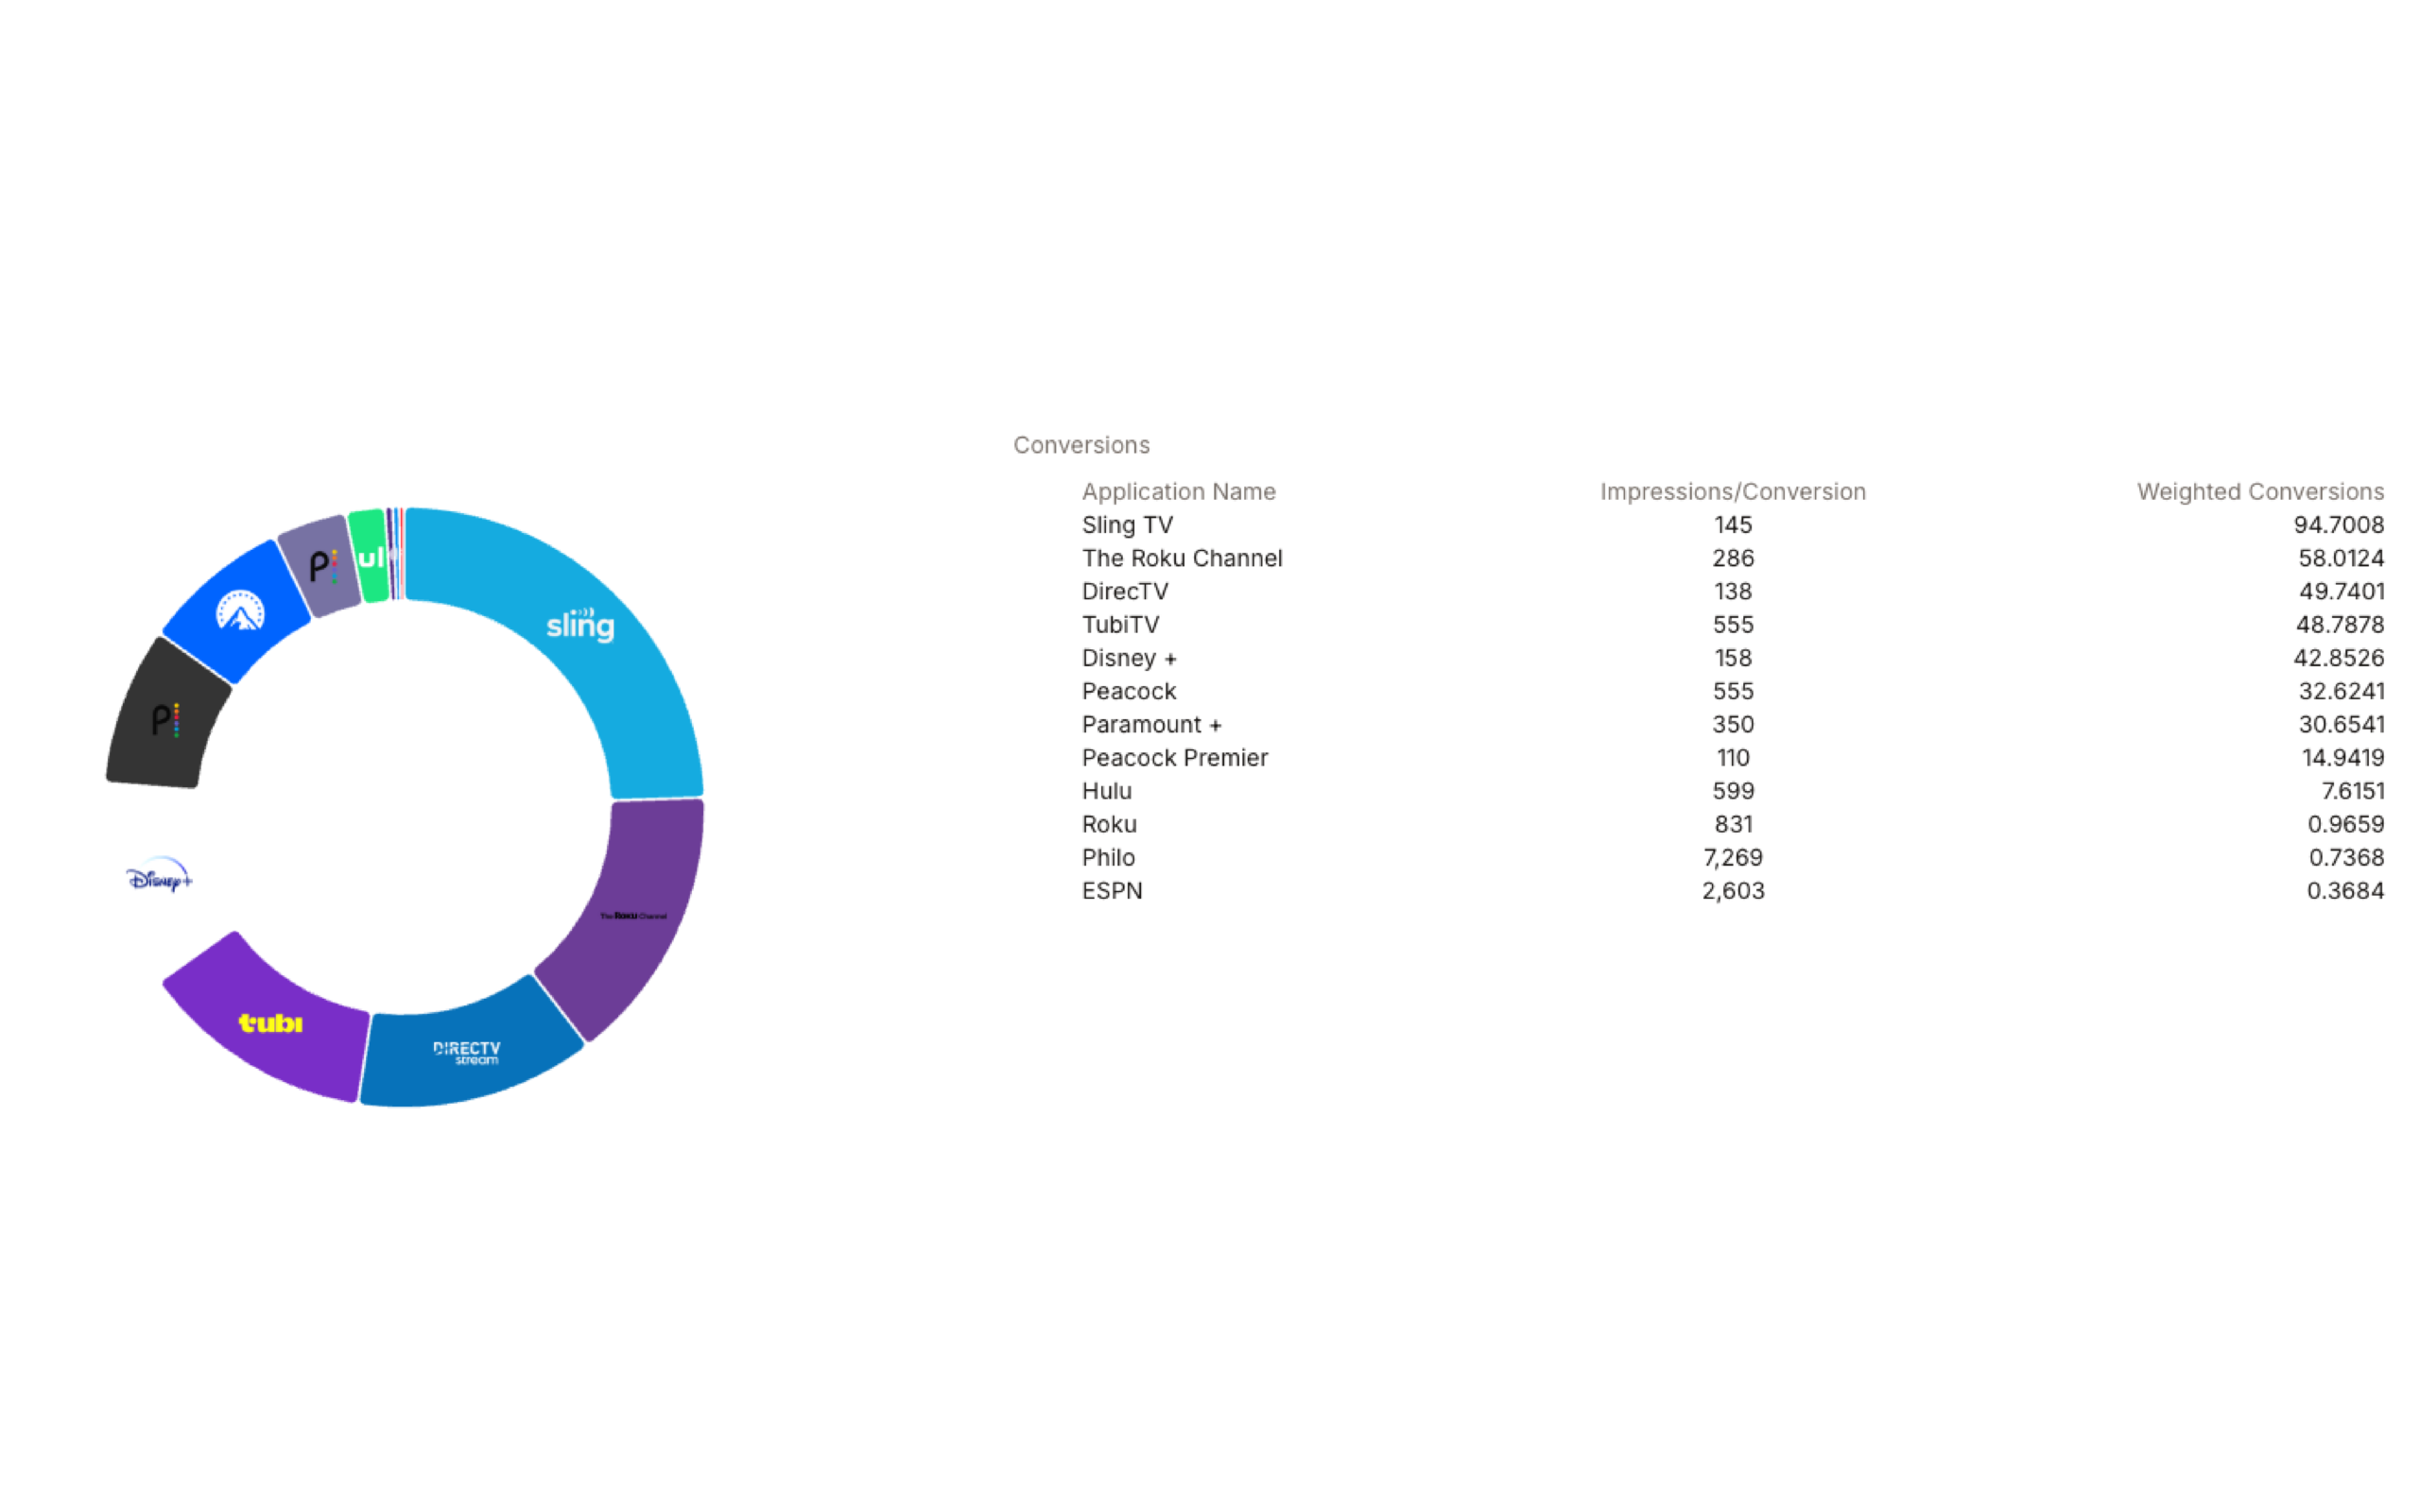
Drill into app-level data across Netflix, Prime Video, Disney+, Hulu, Peacock, and every other major streaming service.
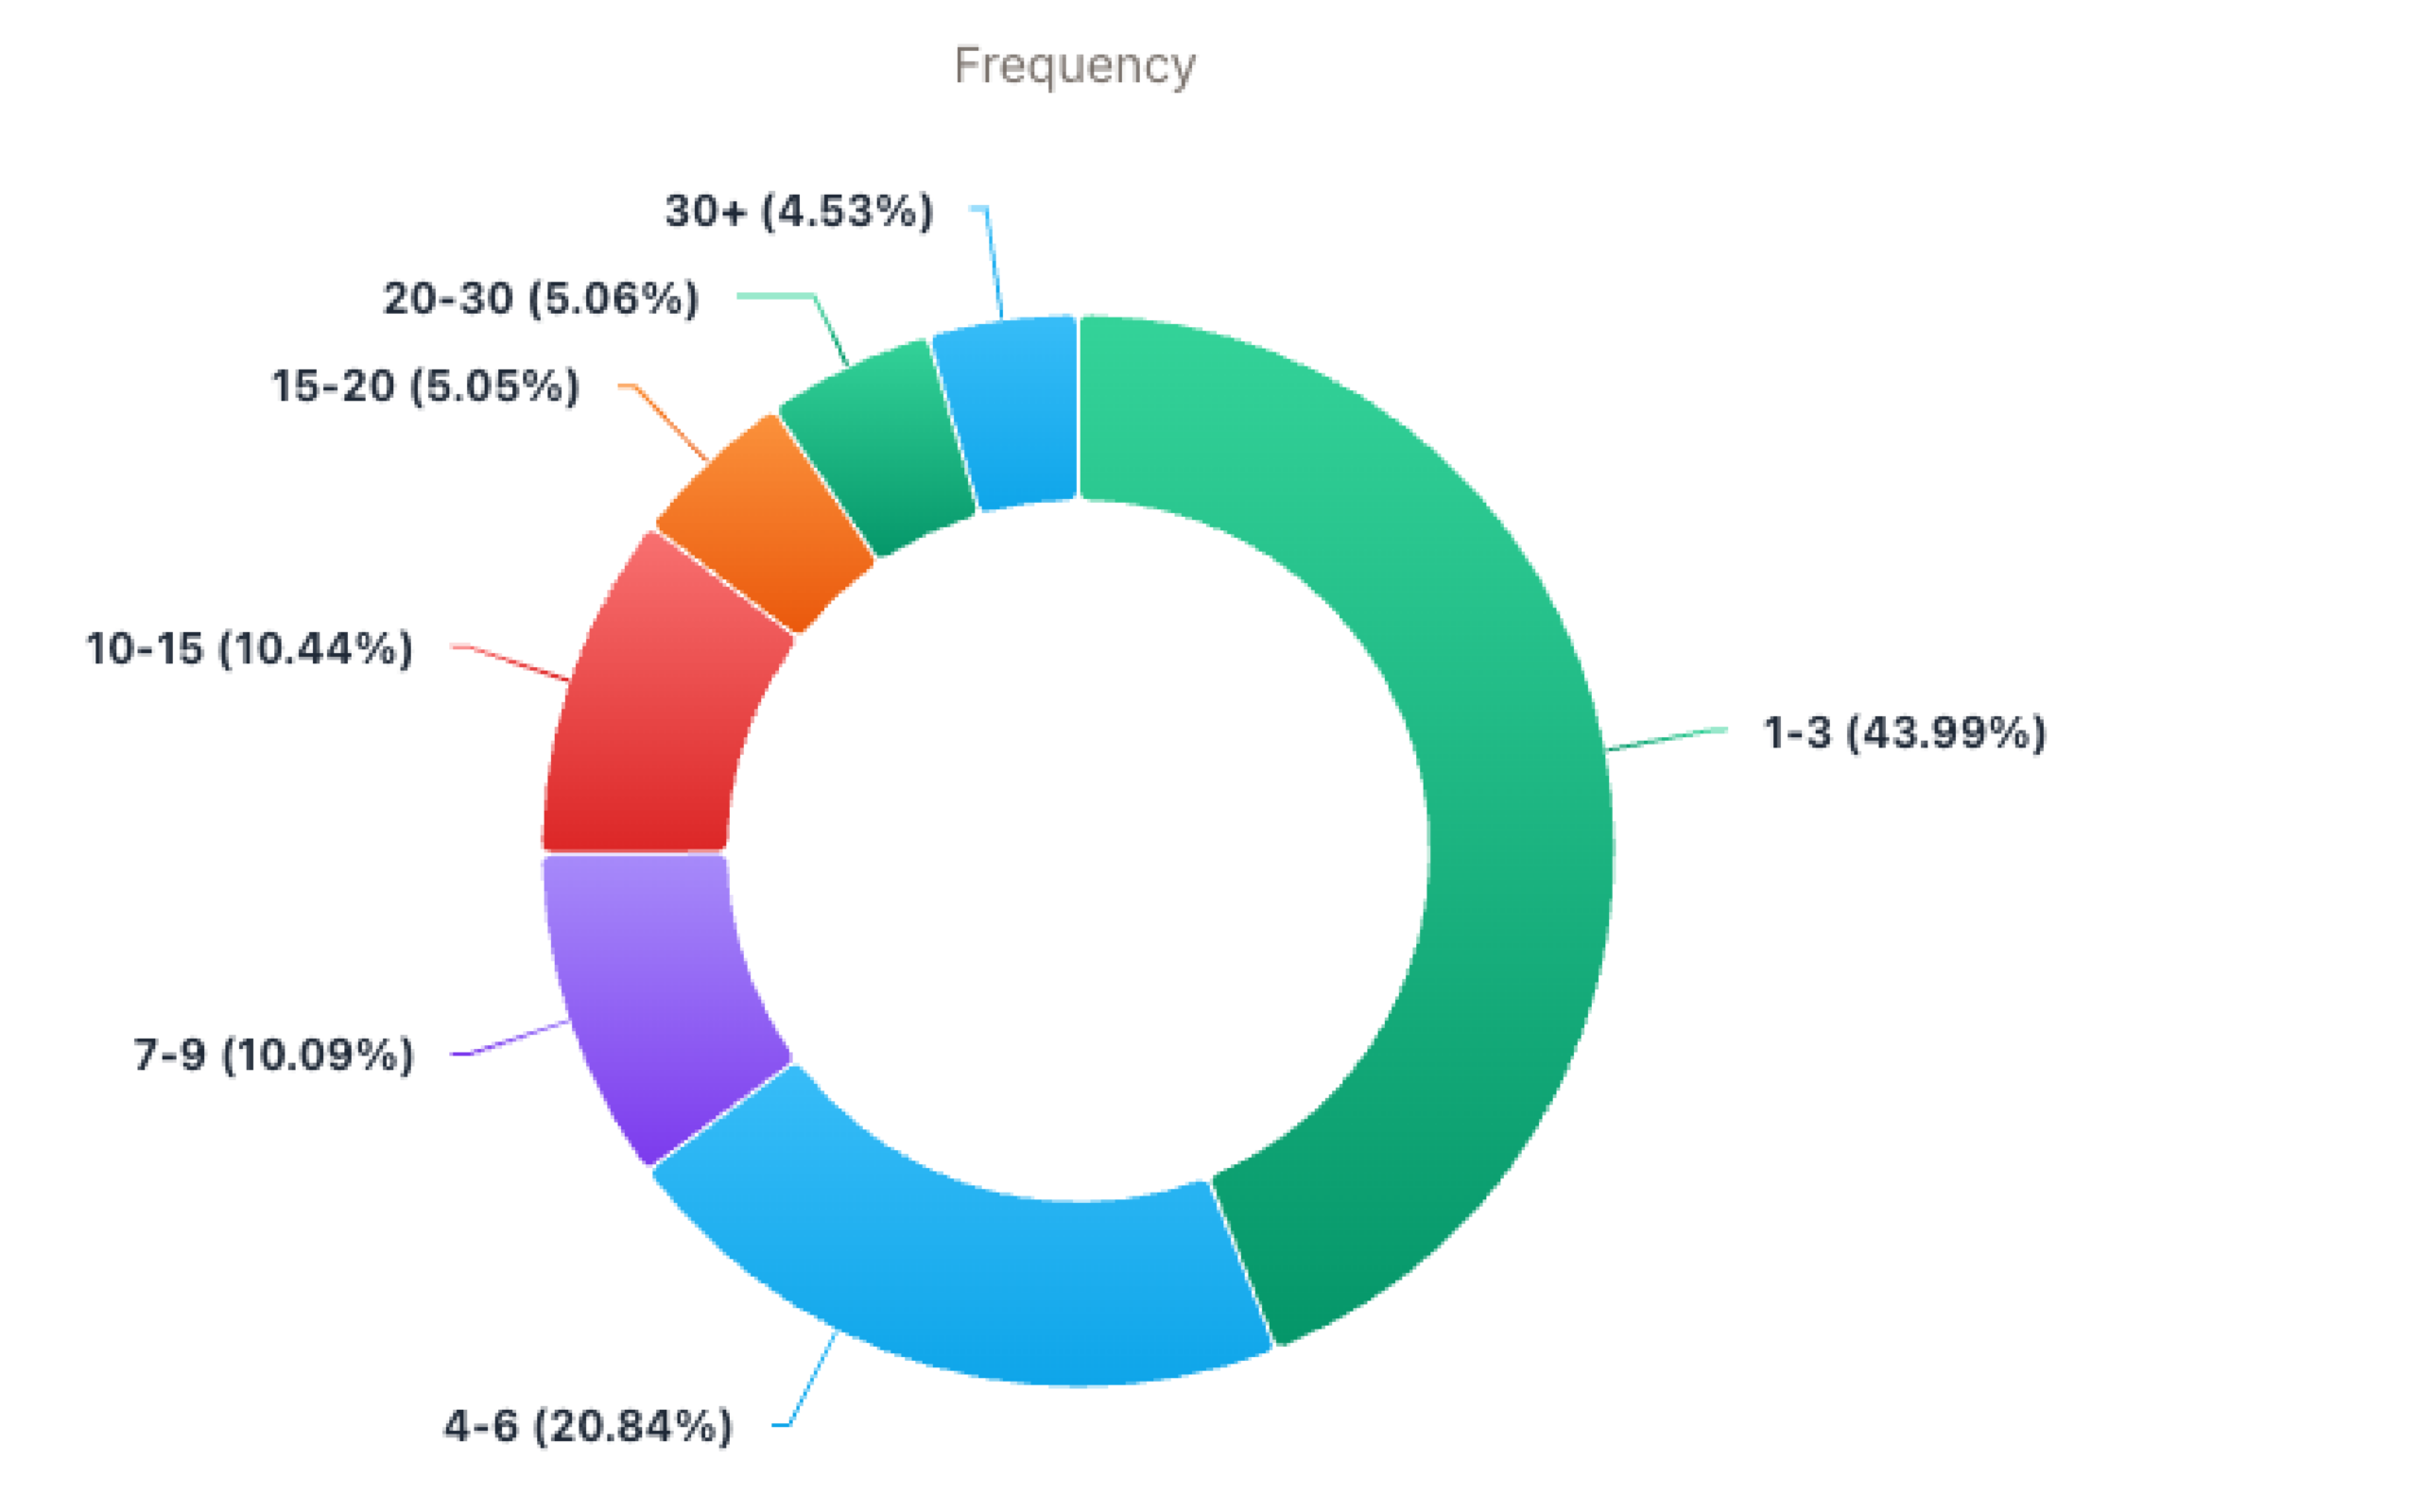
Track frequency caps and household reach so the same person does not see your ad fifteen times in a weekend.
Attribute conversions to the publishers that actually moved a buyer, not just the final click.


+20%
Year-over-year increase in case volume
−10%
Reduction in cost per case
Source: Adduro client case study
A top personal injury firm grew cases by 20% while cutting cost per case by 10%.
Decades of broadcast TV had grown the firm to this point, but broadcast could not deliver the precision they needed to grow cases at a lower cost.
Moving budget into streaming TV with publisher-level reporting and household-level frequency gave them visibility into which placements actually drove new cases. The math their leadership had been asking about for years finally added up.
Read the full case study →How many times does one household see your ads in a single day?
Streaming TV, audio, and display add up faster than you think. Here is one coordinated day in a real household.
7:15 AM
A podcast plays during the morning commute.
12:30 PM
Mobile display ads appear over lunch.
6:45 PM
The evening news plays on the Smart TV.
9:00 PM
The family streams a show after dinner.
10:30 PM
Retargeting follows them to mobile before bed.
That is five exposures on one household across three channels, coordinated under one frequency cap and one unified report.
Common questions about CTV advertising
What is CTV advertising?
CTV advertising delivers ads to streaming apps on internet-connected (connected TV) televisions, as defined by the IAB. It buys the ad slots inside streaming services, with household-level targeting and publisher and app-level reporting that linear TV cannot provide.
How much CTV inventory actually runs on a real TV?
Industry estimates suggest 10 to 30 percent of so-called CTV inventory can run on phones and laptops instead of a television (eMarketer). We report device-level delivery so you can see how much of your CTV advertising actually reached the big screen.
How is CTV measured versus linear TV?
Linear TV gives you a panel-based estimate. CTV advertising reports at the publisher and app level, with attribution back to the dollars you spent, so you see exactly where every impression ran.
There are two ways to take the next step.
Plan your next streaming campaign.
Spend thirty minutes with our team to talk through your audience, where they spend their attention, and what streaming could actually do for your business.
Let's Talk Strategy →Audit your current streaming spend.
We review your current campaign data, identify the gaps, and walk you through what we found on a call. You leave with answers you can use.
Audit My Streaming Spend →